
Markets often feel unpredictable on the surface — prices rise, fall, and consolidate without always offering clear reasons. But when you zoom out, market movements often follow familiar patterns. One of the most time-tested frameworks for understanding these patterns is the Wyckoff method, developed over a hundred years ago and still widely used today.
The Wyckoff method helps explain how large investors accumulate or distribute assets — how they build positions when prices are low, and how they exit them when prices are high — often without most traders even noticing. Whether the market is heading into a new uptrend or beginning a longer decline, these structures provide a useful way to read what’s happening beneath the surface.
Understanding Wyckoff Phases: How Market Cycles Form
Wyckoff structures are broken into five phases — A through E — and apply to both bullish and bearish scenarios. The key difference lies in whether the market is preparing for an upward move (accumulation or re-accumulation) or a downward move (distribution).
Distribution: When the Market Tops Out
In a distribution structure, large investors begin offloading their holdings after an uptrend. They don’t sell everything in one move — instead, they sell gradually during a sideways range while retail traders still believe the rally will continue. Here is how Kaspa price structure looks from the perspective of distribution
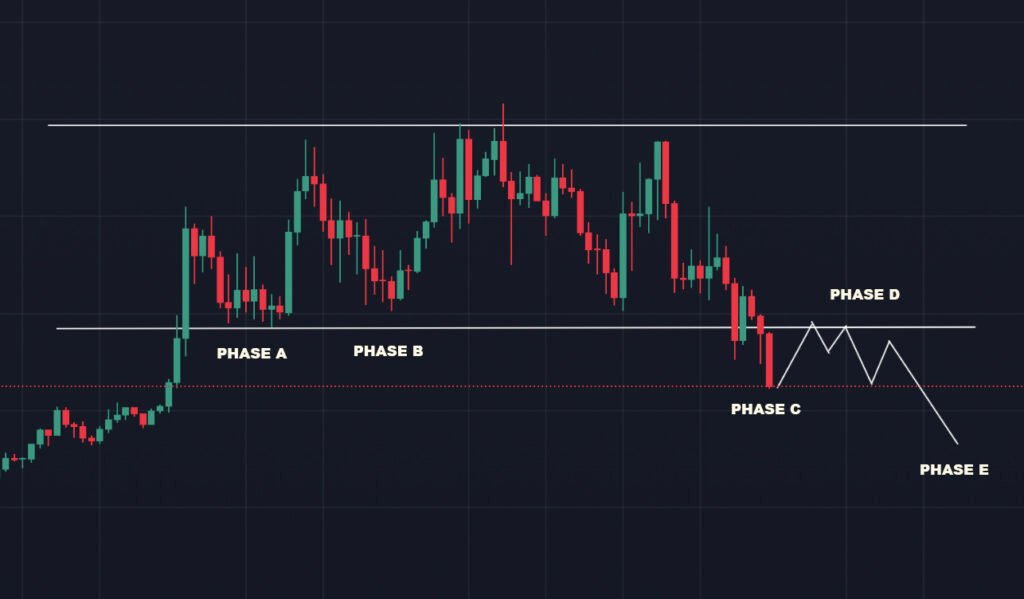
- Phase A is the first sign the uptrend is weakening. Price hits a high, pulls back, and starts to lose momentum.
- Phase B is the range — price moves sideways while distribution quietly takes place.
- Phase C is the trap — price briefly breaks out above the range in what looks like a new rally but quickly fails and goes below crucial support level. This is known as an upthrust, or more specifically, Upthrust After Distribution (UTAD).
- Phase D is the breakdown. Failed rallies, lower highs, and increasing selling pressure appear.
- Phase E is where the real downtrend begins. Price moves decisively lower, and the distribution phase is complete.
Re-Accumulation: A Pause in a Bigger Uptrend
In re-accumulation, the same phases occur — but the context is different. Instead of happening at the top of a cycle, this pattern shows up midway through a larger uptrend. It’s a pause, not a peak — a chance for larger players to build positions again before the next leg higher. Here is how Kaspa price looks from perspective of re-accumulation.
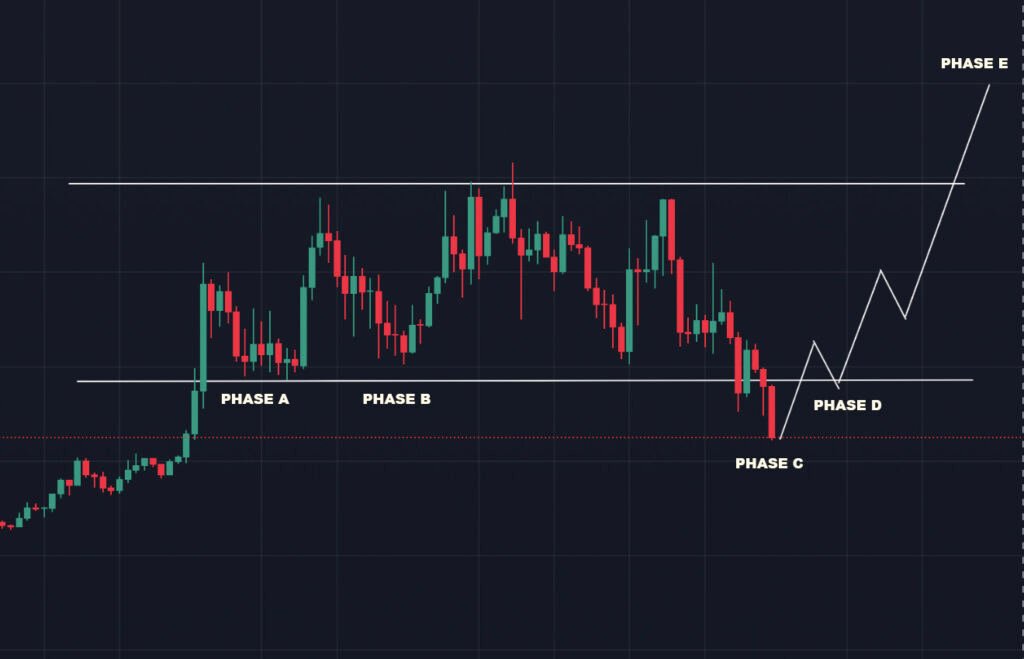
- Phase A begins with a cooling-off period after a rally.
- Phase B forms the range, just like in distribution — but here, supply is being absorbed by long-term buyers.
- Phase C is a shakeout — a quick drop below support that forces weak holders out before price recovers.
- Phase D sees strength return — price climbs back into the range, showing buyers are in control again.
- Phase E is the breakout — the uptrend resumes as confidence returns and demand drives price higher.
Where We Are Now: Kaspa in transition between Phase C and Phase D
Kaspa’s price action is currently sitting at a pivotal moment in this structure — at the end of Phase C. After a strong breakout above 18 cents, the move quickly failed. Price dropped sharply and is now trading around 6 cents, well below what had previously been a key support zone in the 10 cent range.
This decline raises a big question: Was that failed breakout part of a distribution pattern? Or are we simply seeing a shakeout before a larger continuation upward?
It’s too early to say definitively — but what happens next will likely confirm which model is playing out.
Scenario 1: This Is a Distribution Pattern
If price continues to struggle below 10 cents and cannot reclaim that zone soon, it would suggest the structure is a distribution pattern. The breakout above 18 cents would then have been a UTAD — a trap designed to draw in buyers before larger players exited their positions.
In that case, we’re now heading toward Phase D, where price continues making lower highs and struggles to hold any gains. This would eventually lead to a full markdown phase — Phase E — where a more sustained downtrend begins.
Scenario 2: This Is a Re-Accumulation Phase
On the other hand, if Kaspa can recover quickly and push back into the 10 cent range, that would support the re-accumulation thesis. The drop to 6 cents would then be interpreted as a classic shakeout — a Spring, shaking out weak hands before the trend continues higher.
In this case, Phase D would be marked by a return to strength — higher lows, stronger rallies — and eventually Phase E would be a clean breakout, resuming the larger uptrend.
Final Thoughts
Right now, Kaspa is in a critical spot. Whether this structure resolves as a distribution pattern or a re-accumulation phase depends entirely on how price behaves in the coming weeks. If it reclaims resistance and shows signs of strength, the bullish structure remains intact. If not, the market may already be moving deeper into a bearish phase.
What matters most isn’t guessing the outcome, but staying open to both possibilities and watching the structure unfold. It’s worth noting that this article looks at Kaspa purely through the lens of the Wyckoff method, which is just one way to analyze market behavior — it’s equally important to consider broader developments in Kaspa’s ecosystem, overall crypto market sentiment, macroeconomic trends, and other technical or fundamental factors before drawing any firm conclusions. DYOR as usual.