
Kaspa (KAS) is flashing a potentially powerful bullish signal on the weekly chart as it approaches an exit from the Stochastic RSI oversold zone — a technical condition that has historically preceded major price surges for the asset.
What Is Stochastic RSI?
The Stochastic RSI (Stoch RSI) is a momentum indicator that combines the Relative Strength Index (RSI) with Stochastic oscillator calculations. It helps traders identify overbought and oversold conditions with greater sensitivity than standard RSI alone.
- Values range from 0 to 1 (or 0 to 100 when scaled), with readings below 0.2 considered oversold and above 0.8 considered overbought.
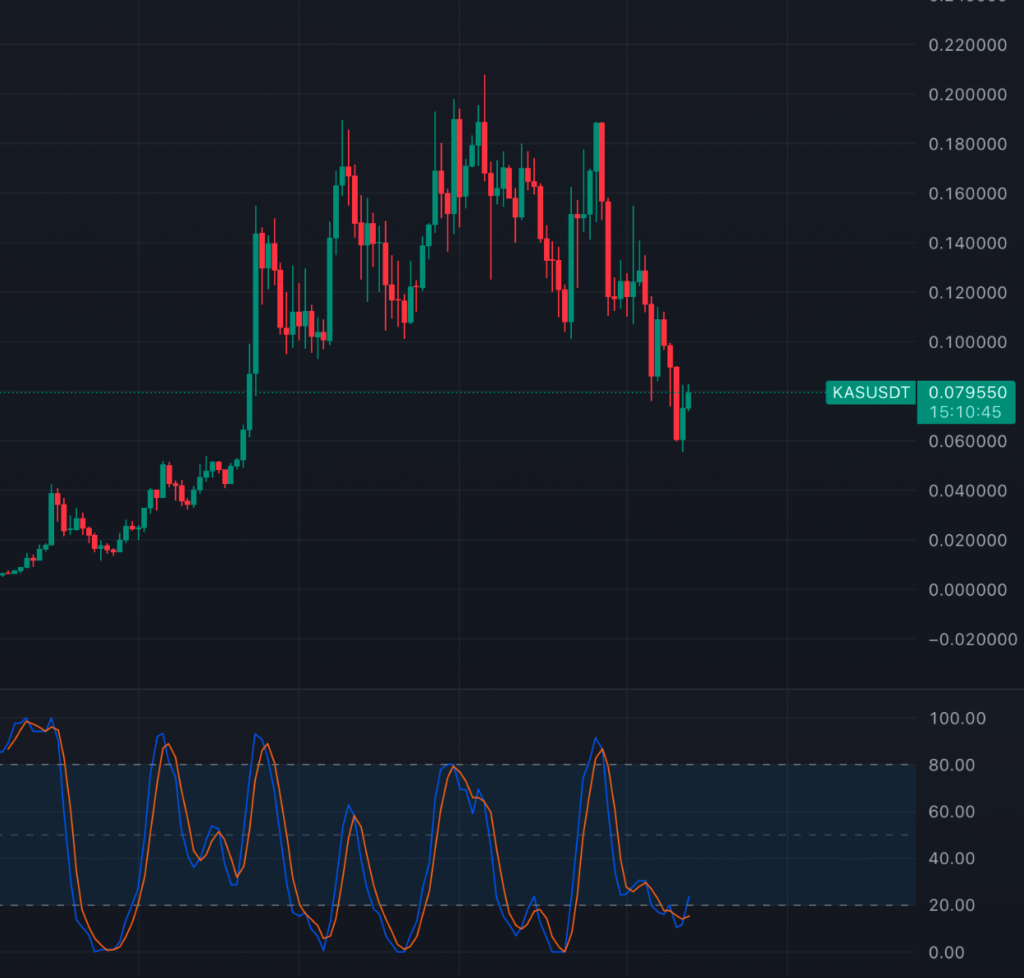
- When Stoch RSI exits the oversold zone and begins to rise, it often signals a momentum shift toward the upside— especially when observed on higher timeframes like the weekly chart.
Historical Performance: A Pattern Worth Noting
Kaspa’s price action has repeatedly responded to this exact signal in the past:
- First instance: Kaspa exited the weekly Stoch RSI oversold zone and kickstarted a massive rally from $0.01 to $0.15, marking the beginning of a strong bull run.
- Following three occurrences: Each time Kaspa emerged from the oversold region, it moved swiftly from range lows to test the major resistance around $0.20 — a key zone that has repeatedly capped price rallies.
Why It Matters Now
Kaspa is once again positioned to exit the weekly Stoch RSI oversold zone. Given its consistent historical reaction to this setup, many traders are watching closely for a potential momentum shift and bullish breakout. If the pattern continues to play out as before, Kaspa could be gearing up for another strong upward move — possibly revisiting the $0.20 resistance zone or beyond.
Final Thoughts
While no technical signal guarantees a specific outcome, recurring patterns often attract attention in crypto markets. With Stoch RSI on the rise from oversold levels and previous setups leading to substantial rallies, this may be a critical moment for Kaspa bulls to watch closely.