
Kaspa (KAS) has been experiencing a period of declining or stagnating price action, yet multiple indicators suggest a potential shift in momentum. The weekly chart is showing bullish divergence, where price continues to make lower lows while key technical indicators, such as MACD, Chaikin Money Flow (CMF), and RSI, signal increasing strength. This divergence suggests that although the price trend remains bearish, underlying market dynamics may be changing.
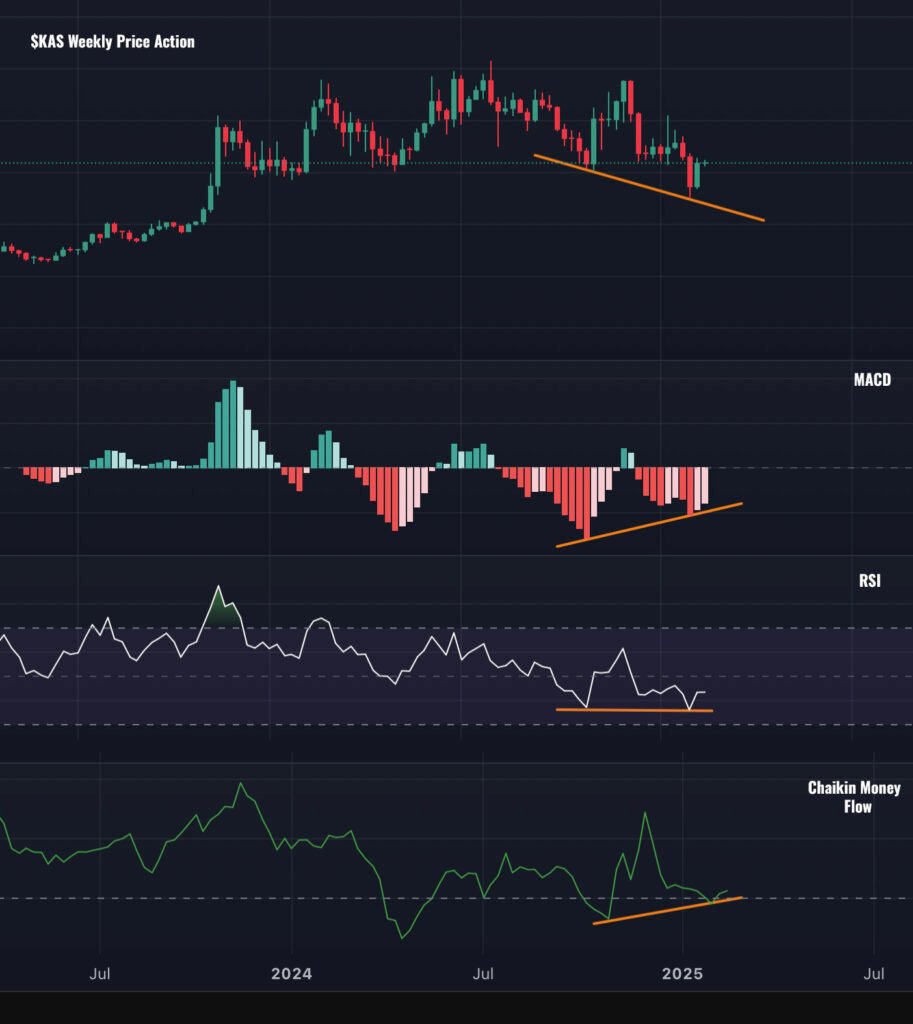
The MACD indicator is forming higher lows, even as price continues to decline. This signals that bearish momentum is weakening, a pattern often seen before a trend reversal. If MACD continues to rise, a bullish crossover could serve as a confirmation that the downward momentum is fading and that market sentiment may be shifting in favor of buyers.
The Chaikin Money Flow (CMF) is also forming higher lows, indicating that institutional accumulation is increasingdespite the current price action. Since CMF measures the volume-weighted flow of capital, a positive divergence here suggests that large buyers may be entering the market while selling pressure dissipates.
- If CMF sustains its upward movement, it would provide further evidence of growing demand.
- However, if CMF fails to break above key levels, it may indicate continued market hesitation.
The Relative Strength Index (RSI) remains in a neutral position, showing neither lower nor higher lows. This suggests that while selling momentum is no longer accelerating, buying pressure has not yet gained full control. When RSI flattens in a bearish market, it can indicate that sellers are exhausting, but confirmation of a shift would require RSI to begin rising and break above key resistance zones.
The divergence among these indicators suggests a potential institutional accumulation phase, where smart money is buying into weakness while retail traders continue to sell. This often precedes a trend reversal or, at the very least, a relief rally, provided that buyers continue to absorb supply at these levels.
While these bullish divergences are early signals of potential market recovery, confirmation is key. To strengthen the case for a reversal, traders should watch for:
- MACD bullish crossover with increasing momentum.
- CMF maintaining upward trajectory, confirming sustained accumulation.
- RSI breaking out of its neutral range forming a higher low on a weekly timeframe, signalling a shift in momentum.
- An increase in trading volume, which would validate increased demand.
Until these conditions align, price action remains at a pivotal stage, where buying pressure is increasing, but the overall trend remains cautious. Traders should closely monitor these indicators for further validation before anticipating a full trend reversal. Holders on the other hand may be cautiously optimistic about long term price action.