
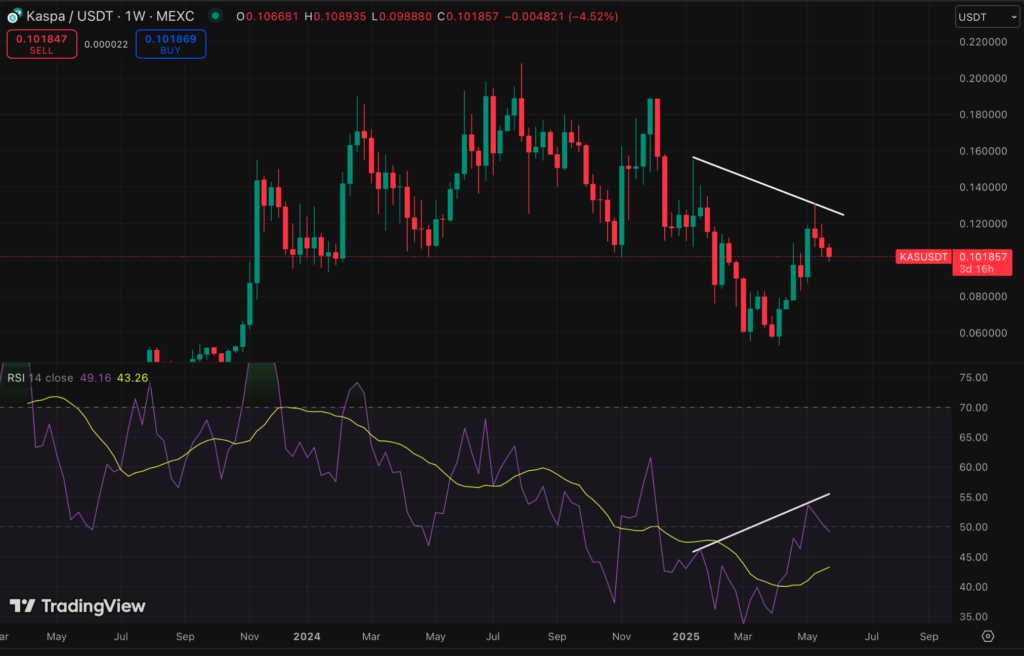
On the weekly timeframe, Kaspa is showing signs of potential short-term weakness. While the price is forming a higher low, the Relative Strength Index (RSI) is printing a higher high — a pattern known as hidden bearish divergence.
This setup typically signals that momentum is fading, even as price attempts to recover. It raises the possibility of a pause or pullback in the current uptrend, especially if bulls fail to reclaim key resistance zones in the coming weeks.
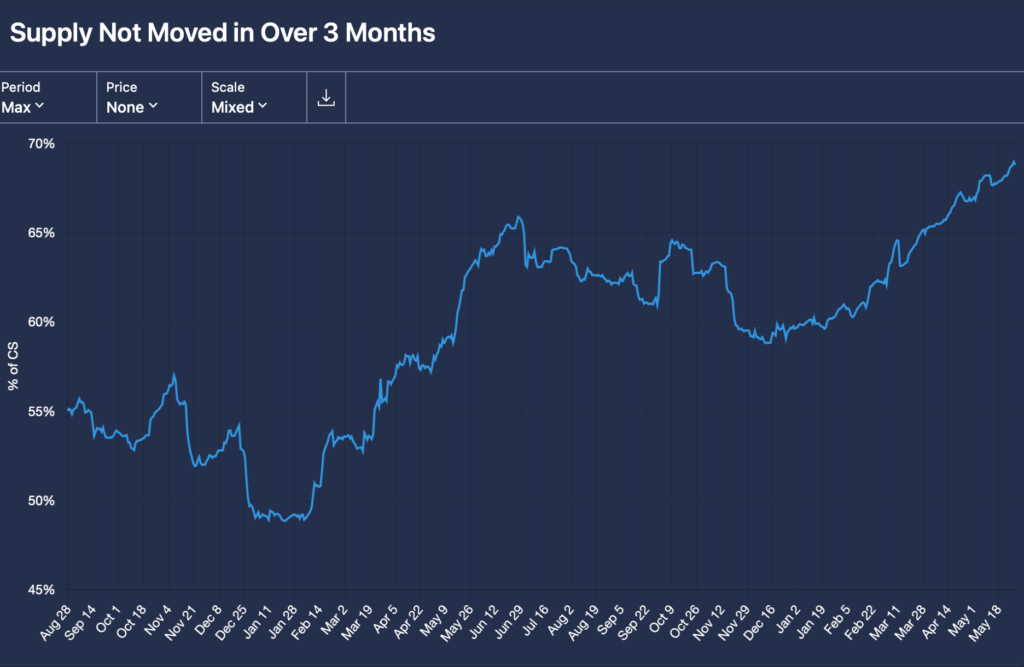
Despite these short-term concerns, long-term confidence in the project remains remarkably strong. Kaspa recently tested the critical $0.10 support zone, yet medium and long-term holders are not moving their coins. In fact, the number of wallets that haven’t transferred their KAS in over three months has reached a new all-time high, approaching 70% of all wallets, according to kaspalytcis.com.
This divergence between technical indicators and on-chain behavior highlights a split in sentiment: market momentum may be cooling, but conviction in Kaspa’s long-term potential continues to grow.
With volatility returning and key levels in play, the coming weeks will be crucial for confirming whether Kaspa can maintain its higher timeframe structure — or if further consolidation lies ahead.