
Kaspa (KAS) remains within a clearly defined falling wedge formation on the weekly chart — a pattern that often signals a potential bullish reversal. However, it’s important to stress that until a confirmed breakout occurs, this formation continues to reflect a consolidation within a broader downtrend. For now, price action remains trapped, and momentum is still leaning toward the bearish side.
The falling wedge structure represents a gradual tightening of price movement, where both lower highs and lower lows compress over time. This kind of formation typically precedes a breakout to the upside, but the breakout alone is not enough. For true bullish momentum to return, Kaspa must reclaim a crucial structural level: the $0.10 zone.
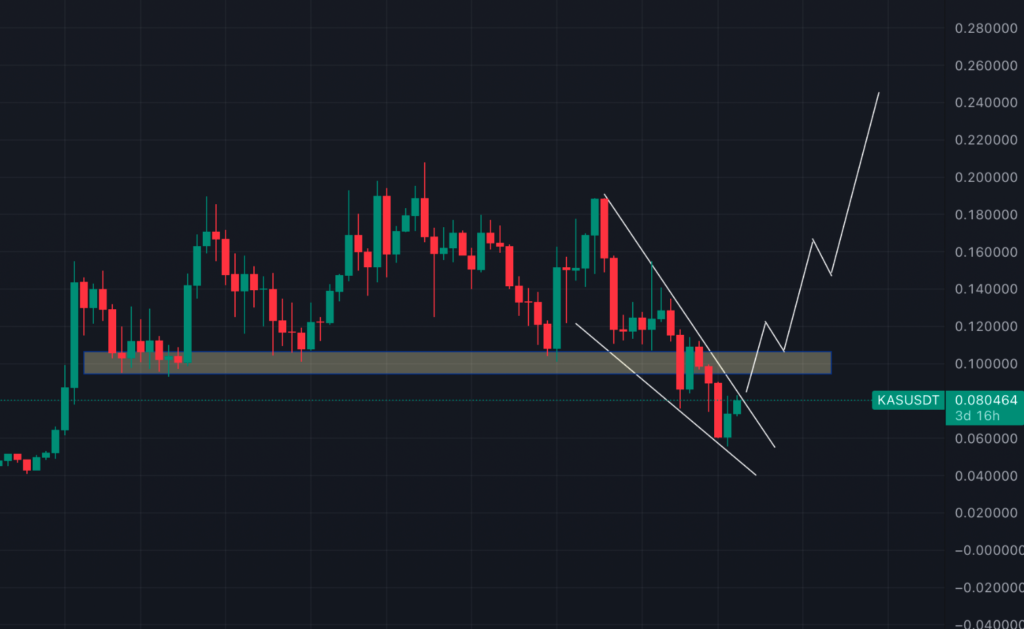
This area around $0.10 served as a significant support in earlier market phases, acting as a base for previous bullish rallies. Now that it has been lost, it has effectively flipped into resistance. The market’s response at this level will be pivotal.
A confirmed breakout above the falling wedge on the weekly timeframe, followed by a sustained weekly close above the $0.10 region, would be the first strong signal that bullish momentum is beginning to build. It would indicate that buyers are stepping back in with conviction and that the downtrend may be weakening. This reclaim would open the door for further price appreciation and potentially a larger trend reversal.
On the other hand, failure to break and close above the $0.10 resistance would suggest that current momentum remains bearish. Such a rejection could confirm that the recent price action is part of a broader distribution phase, with the risk of further downside still present. In this scenario, sellers would likely remain in control, and the falling wedge could begin to break down instead of break out.
The coming weeks will be critical. Kaspa remains at a technical crossroads, and what happens at the upper edge of the wedge and around the $0.10 mark will shape the next major leg — whether that be continuation to the downside or the start of a new bullish trend.
For now, all eyes remain on the weekly close.