
Kaspa’s price action on the weekly chart is flashing signs that something big is on the horizon. Multiple indicators are lining up, each pointing to tightening conditions and an upcoming breakout. Here’s what they’re telling us.
Bollinger Bands Contracting
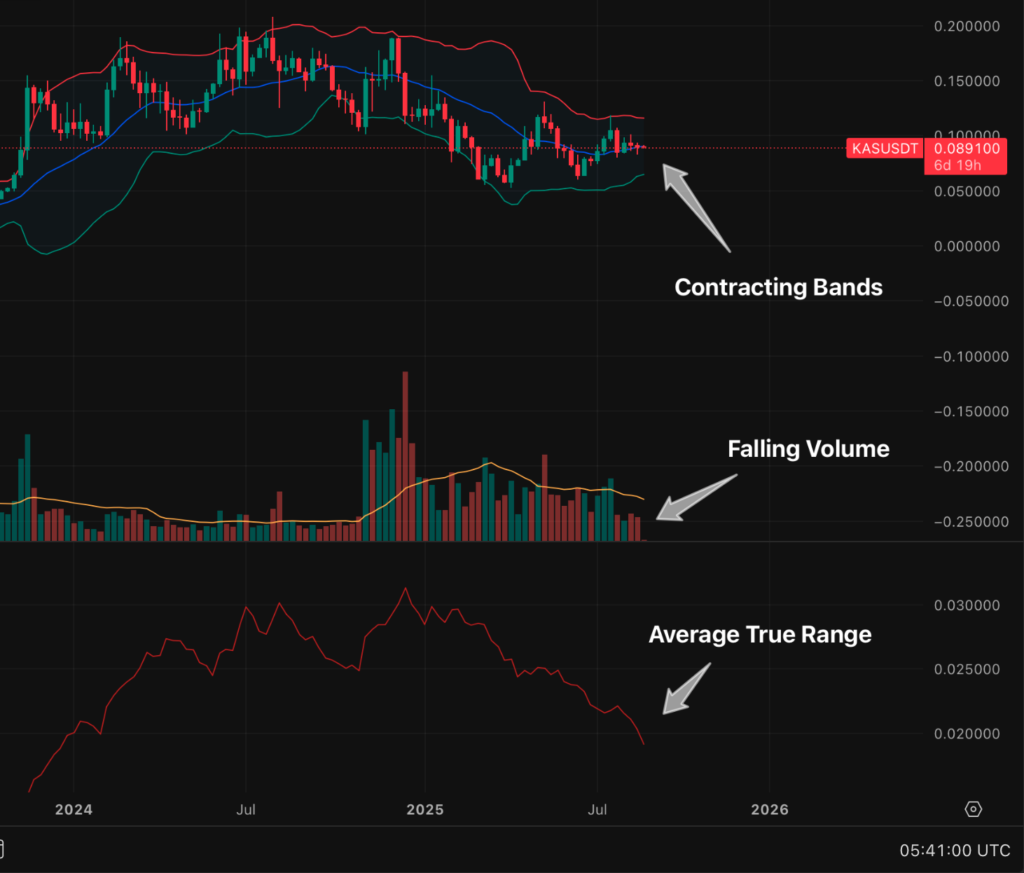
Bollinger Bands expand and contract based on volatility, and right now, Kaspa’s weekly bands are squeezing closer together than they have in a long time. This “squeeze” phase often means the market is coiling up before releasing a strong move. The tighter the bands get, the bigger the breakout tends to be when volatility returns.
Declining Trading Volume
Volume is the fuel behind every trend. Lately, Kaspa’s trading volume has been falling, showing that market participants are in a wait-and-see mode. When activity dries up like this, it often precedes a sharp return of volatility once traders regain conviction.
Average True Range (ATR) Dropping
The ATR measures the average size of price swings. On the weekly timeframe, Kaspa’s ATR has been sliding lower, signaling reduced volatility and compressed movement. History shows that once ATR bottoms, it usually rebounds sharply — and price tends to follow with bigger swings.
Why It Matters
When Bollinger Bands contract, trading volume falls, and ATR drops all at once, the market is in a “compression phase.” These phases don’t last forever. They usually end with powerful moves, often catching traders off guard with their speed and strength.
Kaspa’s chart is making one thing clear: while direction remains uncertain, the next significant move is drawing closer. Patience now could set the stage for big opportunities ahead.